The EQAVET framework comprises an action pattern for quality assurance and quality improvement, based on the PDCA cycle of planning, implement - ation, evaluation and review, supported by common quality criteria and indicative descriptors (Annex I of the recommendation) and a coherent set of quality indicators (Annex II of the recommendation), which can be used both at VET provider and VET system levels.

Following the PDCA cycle, the EQAVET framework suggests application of a circular quality assurance framework that comprises:
The principle of the quality cycle is easy to understand, because it applies instinctively in everyday life. However, it is the systematic, continuous and regular use of the cycle that makes the difference when establishing a quality framework.
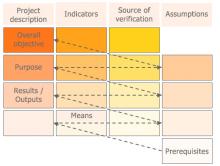
The result of the Logical Framework Approach (LFA) is a Project Planning Matrix (PPM), which shows the interrelation of the four hierarchical levels – overall goal, objective, expected result, and activities – in a logical fashion. For each level, indicators and external factors have to be identified.

SWOT-analysis is a tool where you can find out your own Strengths and Weaknesses as well as looking for Opportunities and Threats you face now or will face in the future. It is a simple method but nevertheless quite powerful to help you understand your business and how to act in the future.
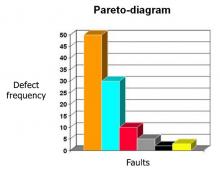
A Pareto diagram is a simple bar chart that highlights related measures in decreasing order of occurrence. It is often used for Quality Control purposes to represent common causes of defects, which are ranked by type or most common reasons for customer complaints.
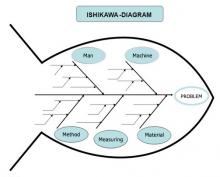
Another technique used are Ishikawa Diagrams also known as "Cause and Effect Diagrams". Which help the organisation to think through causes of a problem thoroughly.
This project has been funded with support from the European Commission. This publication [communication] reflects the views only of the author, and the Commission cannot be held responsible for any use which may be made of the information contained therein.