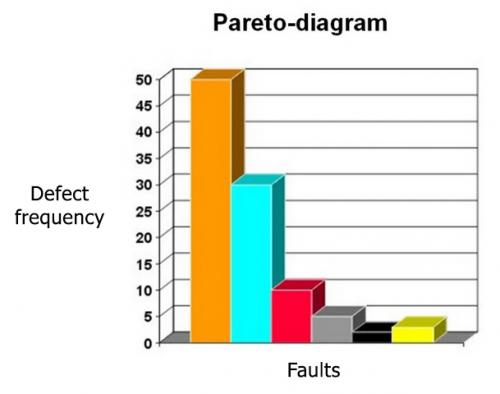
A Pareto diagram is a simple bar chart that highlights related measures in decreasing order of occurrence. It is often used for Quality Control purposes to represent common causes of defects, which are ranked by type or most common reasons for customer complaints. The purpose of a Pareto diagram is to separate the significant aspects of a problem from the trivial ones. By graphically separating the aspects of a problem, a quality control team will know where to direct its improvement efforts. Concentrating on reducing the larger bars identified in the diagram will do more fór overall improvement than concentrating the smaller ones.
This project has been funded with support from the European Commission. This publication [communication] reflects the views only of the author, and the Commission cannot be held responsible for any use which may be made of the information contained therein.